Understanding Trading View: Features and Benefits
In the fast-paced world of financial markets, having access to reliable, comprehensive, and real-time data is essential for traders and investors. trading view has emerged as a leading platform, offering a robust suite of tools and features designed to empower users to analyze, strategize, and execute trades with confidence. This platform is not just a charting tool; it is a multifaceted social network and analytical environment that caters to both beginners and seasoned professionals. Understanding its core tools and interface is pivotal to leveraging its full potential for successful trading endeavors.
Overview of Trading View’s Core Tools and Interface
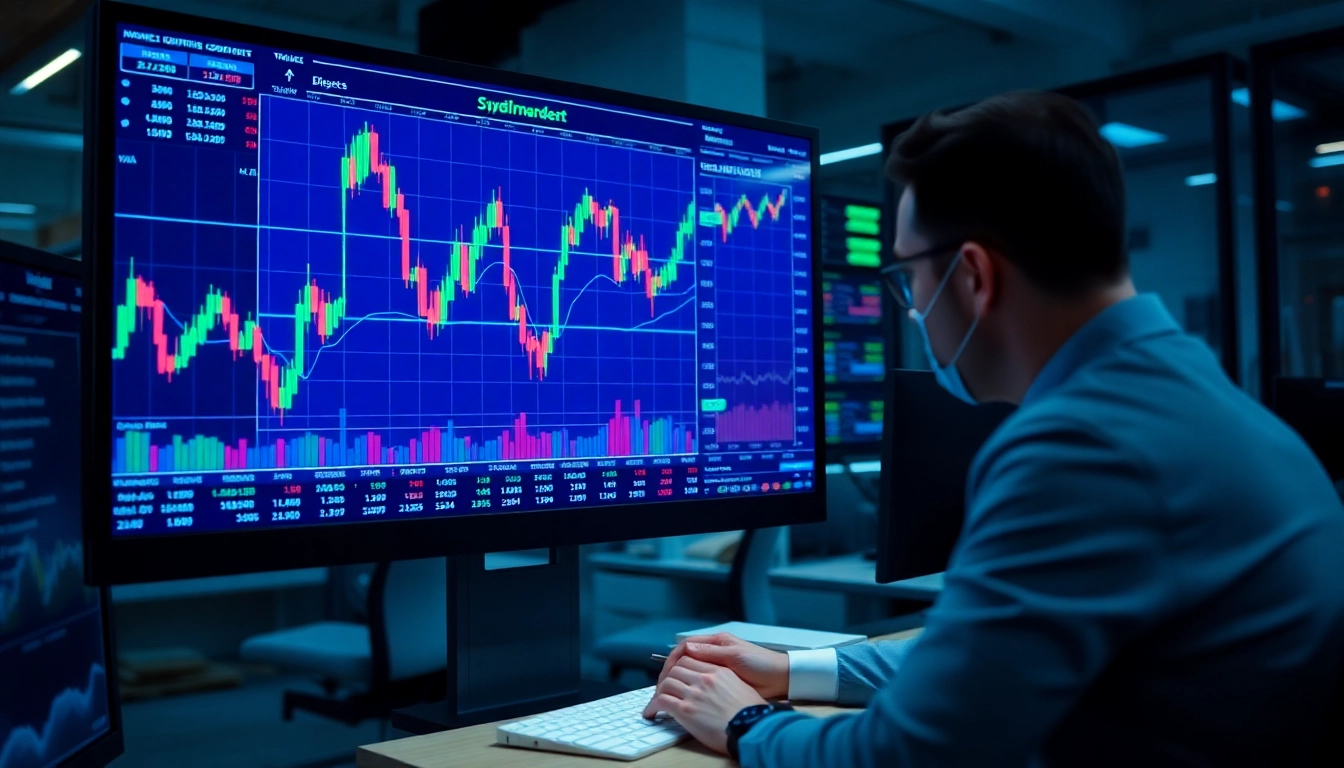
At its core, Trading View provides an intuitive and customizable interface packed with sophisticated charting capabilities. Its core tools include a wide array of technical indicators, drawing tools, and analytical overlays that help traders decipher market trends and potential reversal points. The platform’s clean design allows users to arrange multiple charts, overlay different assets, and access real-time data streams seamlessly. Interactive features such as one-click drawing, trend lines, Fibonacci retracements, and pattern recognition enable traders to visualize complex market scenarios easily.
Beyond basic charting, Trading View integrates a social element—traders can share ideas, strategies, and setups directly within the platform. The community feature fosters collaborative learning and idea exchange, which is invaluable for refining one’s trading approach.
Advantages of Using Trading View for Live Market Analysis
One of the platform’s standout advantages is its real-time data processing across multiple markets including stocks, cryptocurrencies, forex, commodities, and indices. This allows traders to monitor global markets simultaneously, making timely decisions based on the most current information. The cloud-based nature of Trading View ensures accessibility from any device—desktop, tablet, or smartphone—without sacrificing speed or functionality.
Its extensive library of technical indicators—over 100 built-in and the capacity to create custom scripts using Pine Script—offers unparalleled flexibility. Alerts can be set based on price levels, indicator conditions, or pattern recognitions, providing automated notifications that help traders to act swiftly.
How Trading View Enhances Trading Strategies
Trading View enhances strategies by facilitating detailed analysis and testing. Its backtesting feature allows traders to evaluate historical performance of specific setups, reducing the risk associated with live trading. The platform’s social sharing feature enables traders to observe collective insights, crowd-sourced ideas, and trending strategies, fostering a community-driven approach to market analysis. By integrating multiple data streams and analytical tools into one interface, traders can formulate, refine, and execute strategies more effectively.
Getting Started with Trading View
Creating an Account and Navigating the Dashboard
Initiating your journey with Trading View begins with creating a free account. The registration process is straightforward—simply provide an email address and create a password. Once logged in, users are greeted with a customizable dashboard featuring recent charts, market watchlists, and notifications. The user-friendly interface allows easy navigation through various market sections, trading tools, and social features. The dashboard is designed to be adaptable, enabling traders to personalize their workspace according to their preferences and trading style.
Setting Up Custom Watchlists and Alerts
Watchlists are fundamental for monitoring multiple assets simultaneously. Trading View allows users to create and manage personalized watchlists, adding stocks, cryptocurrencies, currencies, or commodities with a simple search and click. Alerts can be set on price movements, indicator thresholds, or pattern formations. For instance, a trader might set an alert for when Bitcoin crosses a specific resistance level, ensuring they are notified instantly to act decisively. This proactive approach is vital in volatile markets where timing is critical.
Accessing and Interpreting Interactive Charts
The platform’s interactive charts are central to its appeal. They allow traders to visualize historical and real-time data dynamically. Each chart supports multiple timeframes—from seconds to months—enabling detailed intraday analysis or long-term trend assessment. Users can zoom, scroll, and customize their charts with various tools, including trend lines, support/resistance zones, and pattern annotations. Interpreting these visuals informs trading decisions, such as entry and exit points, stop-loss placements, and profit targets.
Advanced Trading View Techniques
Utilizing Technical Indicators and Drawing Tools
Advanced traders harness an extensive library of technical indicators—Moving Averages, RSI, MACD, Bollinger Bands, and more—to identify trade setups and market momentum. Combining multiple indicators can improve accuracy; for example, using RSI to confirm overbought conditions alongside price action signals. Drawing tools such as Fibonacci retracements, channels, and trend lines help visualize potential reversal zones and breakout points. Mastering these tools allows traders to develop robust, data-driven strategies.
Integrating Trading View with Trading Platforms
For a seamless trading experience, Trading View can connect directly with several brokerage accounts and trading platforms via its Trading Panel feature. This integration allows traders to execute orders without leaving the chart environment, reducing latency and improving order accuracy. Setting up these integrations requires API keys and platform permissions but streamlines workflow—particularly beneficial for active traders operating in high-speed markets.
Analyzing Multiple Markets and Asset Classes Simultaneously
Market correlations play a significant role in risk management. Trading View’s multi-chart layouts enable simultaneous monitoring of different markets—such as stocks, forex pairs, and cryptocurrencies—offering a holistic view of market sentiment. For example, observing gold prices alongside the US dollar can inform inflation hedge strategies. Cross-market analysis enhances decision-making by revealing interdependencies and potential divergence signals.
Optimizing Your Trading Performance with Trading View
Implementing Strategy Backtests and Paper Trading
Before risking real capital, traders can backtest strategies using Trading View’s historical data. This process involves applying trading rules to past price movements to estimate future performance. Paper trading, enabled within the platform, allows traders to practice executing strategies in a simulated environment. These features foster a deeper understanding of strategy viability and help mitigate emotional biases during live trading.
Sharing and Collaborating on Market Ideas
The social aspect of Trading View is a powerful tool for learning and inspiration. Traders can publish their ideas, annotate charts, and receive feedback from a global community. Analyzing others’ ideas and trading setups exposes users to diverse approaches and new analytical techniques. This collaboration elevates individual skill levels and fosters a vibrant ecosystem of shared knowledge.
Monitoring Performance Metrics and Improving Tactics
Consistent evaluation of trading performance is crucial. Trading View offers insights into trading history, win/loss ratios, and risk-reward metrics. By reviewing these metrics regularly, traders can identify strengths, weaknesses, and areas for improvement—be it refining exit strategies or adjusting position sizes. Data-driven refinement ensures continuous growth and adaptation to ever-changing markets.
Future Trends and Updates in Trading View
Emerging Features and Platform Enhancements
The platform is continually evolving, with upcoming features including AI-powered analysis, improved alert systems, and enhanced integrations with brokers. These innovations aim to streamline workflow, enhance predictive capabilities, and provide deeper insights into market trends.
Community and Social Trading Integration
The rise of social trading features is reshaping how traders learn and execute ideas. Integrating social feeds directly into the platform will facilitate real-time discussion, collaborative analysis, and collective strategy development, making Trading View a comprehensive social trading hub.
Adapting to Market Evolution with Trading View
As markets become increasingly complex and data-driven, Trading View’s commitment to technological enhancement positions it as a vital tool for navigating future financial landscapes. Embracing machine learning, expanding asset coverage, and refining user experience will ensure it remains at the forefront of trading platforms.